
You will learn about cold and warm fronts, how to predict wind speed and direction, different air masses and their associated weather.
This online training for Deck Cadets is aligned with the Standards of Training, Certification and Watchkeeping (STCW) and the UK MCA / Scottish Qualifications Authority (SQA) Level 7 Marine Meterology unit.
This learning can be used to study and prepare for:
- Marine Meteorology: An Introduction assessment
- UK MCA Orals assessment
You can see the contents of what is contained in this unit in the contents list below, and subscribe here.
- What is a Synoptic Chart?
- Features of a Synoptic Chart
- Features of a Synoptic Chart
- Fronts
- Warm Front
- Cold Front
- Occulded Fronts
- Troughs
- Predicting the Wind Direction
- Buy’s Ballots Law
- Predicting Wind Speed
- Formation of Winds
- What is Air?
- The Movement of Air
- Pressure Gradient Force
- Coriolis Effect
- Formation of Land Breezes
- Formation of Sea Breezes
- Air Masses
- Summer Air Masses in the UK
- Tropical Continental
- Polar Continental
- Tropical Maritime
- Polar Maritime
- Returning Polar Maritime
- Arctic Maritime
- Winter Air Masses
- Tropical Maritime
- Polar Maritime
- Arctic Maritime
- Polar Continental
- Climatic Zones
- General Circulation of the Atmosphere
- Main Climatic Zones over the Oceans
- Ocean Currents of the World
- Seasonal Weather
- Tropical Revolving Storms
- Monsoons
- SW Monsoon
- Meteorological Observations
- Beaufort Scale
- Waves
- Apparent Wind
- True Wind
- Horizontal Visibility
- Types of Cloud
- Cirrus Clouds (Ci)
- Cirrostratus (Cs)
- Cirrocumulus (Cc)
- Altostratus (As)
- Altocumulus (Ac)
- Nimbostratus (Ns)
- Stratus (St)
- Stratocumulus (Sc)
- Cumulus (Cu)
- Cumulonimbus (Cb)
What is a Synoptic Chart?
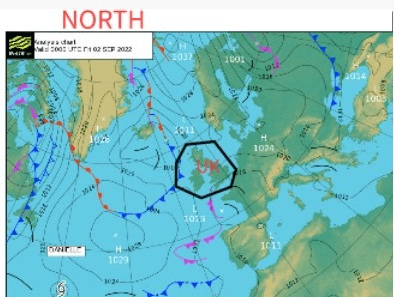
The word ‘synoptic’ means a summary of the current situation. In weather terms, a synoptic or pressure chart is a map that summarises the atmospheric conditions over a wide area at a defined time.
The first thing you need to find on a pressure chart is where you are. You can do this by either using the latitude and longitude, or by finding where you are on the land. We will be using met office charts. On these synoptic charts the UK is located fairly centrally, with Iceland and Greenland to the top left and continental Europe to the right. North is not at the top of the page, but where the lines of longitude converge, in the top left corner. This means we can see as much as possible of the relevant area around the UK.
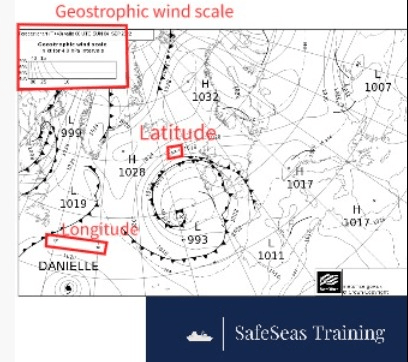
The Met Office produces the synoptic charts you will use to predict the weather for your exams in black and white. This has a number of other features, when compared to the colour charts. These are:
- Markings of latitude and longitude
- Geostrophic wind scale
Features of a Synoptic Chart
Subscribe to get access
Read more of this content when you subscribe today.
